One county, one budget line
We call much of what the library offers “free” because patrons do not pay at the point of use: books, programs, computers, internet access, research help, and a place to simply be. Public investment makes all of it possible, and in Orange County the structure of that investment is unusually straightforward.
About 95% of the library’s operating revenue comes directly from Orange County. State support accounts for about 4%, while federal and other sources together contribute about 2%. Those outside funds help, but they cannot replace county support for staff, hours, buildings, and collections.
Both the Main Library in Hillsborough and the Southern Branch in Carrboro are operated directly by the county. Unlike some public libraries, OCPL does not have a separate municipal funding base. The county budget largely determines what the library can offer each year.
Where the money comes from
Library funding can include local, state, federal, and private sources. In Orange County, almost all of it is local.
How these percentages were calculated
Funding source percentages are computed from Orange County Public Library’s FY2025 income reporting to the State Library of North Carolina (local, state, and federal dollars as reported; “other” is the remainder). The chart shows the relative share of support by source; it is not intended to suggest that Friends support can or should substitute for public funding.
Source: NC State Library of North Carolina, Statistical Report of North Carolina Public Libraries.
How the funding compares
Across the United States, public libraries average about $48.21 per resident in annual operating spending. North Carolina public libraries average $27.95, 42% less, placing the state near the bottom nationally.
Orange County does better than the state overall. At $35.94 per resident, it ranks 17th among North Carolina’s 84 library systems and exceeds the statewide median of $25.66. Even so, Orange County remains about 25% below the national average.
That is the context for the Friends’ work: OCPL performs well within an underfunded state, but it still has fewer resources per resident than the typical public library nationwide.
The most recent available reporting years differ: national and North Carolina figures are FY2024 (IMLS); Orange County’s is FY2025, from its latest report to the State Library of North Carolina.
See every North Carolina system, FY2025 ↓
Orange County highlighted; the dashed line is the statewide median ($25.66). Hover any column for the system and figure. Source: Statistical Report of North Carolina Public Libraries, FY2025 (per-capita operating expenditure: personnel + collections + other).
See every state, FY2024 ↓
North Carolina highlighted. Source: IMLS Public Libraries Survey, FY2024; DC, U.S. territories, and special-service libraries excluded. Orange County’s own FY2024 figure at that vintage was $30.61; the tile above shows its latest State Library report.
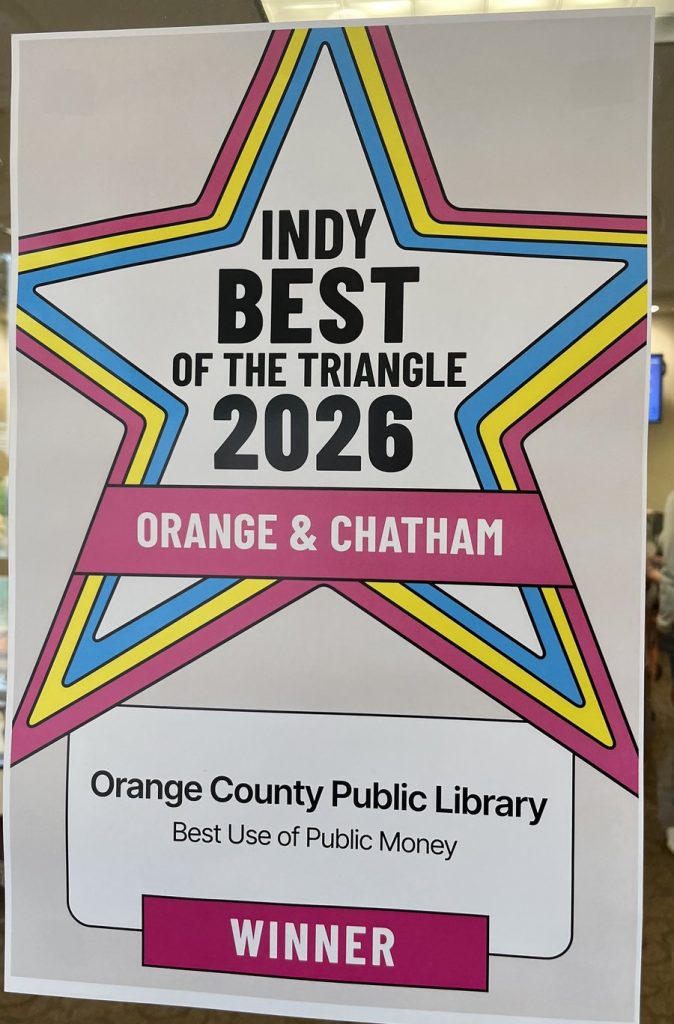
“Best Use of Public Money”
Readers of INDY Week voted the Orange County Public Library Best Use of Public Money in the 2026 Best of the Triangle poll for Orange and Chatham counties. OCPL’s operating cost is approximately $35.94 per resident per year.
What that ten cents a day buys
Ten cents a day supports a library whose use is growing.
| Measure | FY2023 | FY2024 | FY2025 | 3-yr change |
|---|---|---|---|---|
| In-person visits | 117,270 | 149,660 | 185,863 | +58% |
| Items borrowed (all formats) | 401,189 | 513,512 | 632,712 | +58% |
| Public-access computers | 27 | 43 | 71 | +163% |
| Public-computer sessions | 12,534 | 16,095 | 18,019 | +44% |
| Annual open hours | 5,928 | 5,928 | 6,240 | +5% |
Source: Statistical Report of North Carolina Public Libraries / IMLS Public Library Survey, FY2023–FY2025. FY2025 reflects the Southern Branch opening in February 2025, the full effect of a second location is still ahead.
Orange County residents borrow more items per person than the statewide average. A library card also provides access to more than 140 free programs, services, and subscriptions; public computers and internet service; and research databases, along with a digital collection of more than 830,000 e-books, audiobooks, and videos.
The collection is increasingly digital, but the library’s reach is still deeply local. More than 24,000 residents hold cards, and another 32,000 K–12 students receive access through school partnerships. The library also provides meeting space, early-literacy programs, workforce resources, and reliable internet access for residents who may not have them elsewhere.
Research in other communities has found that library investment can return several dollars in public value for each dollar spent, through workforce support, early literacy, digital access, and increased activity around library locations. Those studies are not a direct measurement of OCPL, but they illustrate the wider value a well-used public library can create.
Why that funding can be vulnerable
When nearly everything comes from one county budget line, the library’s future is reconsidered each spring alongside every other public need. That is normal county budgeting, but it also means a single difficult year can quickly affect hours, programs, collections, and staffing.
In 2026, Orange County faced rising costs, growing service demands, and major capital needs. The county manager’s recommended budget reduced Library Services by about $133,759, and budget amendment OP-B08 proposed an additional $200,000 reduction, a combined decrease of roughly $333,759. Commissioners had the difficult job of balancing many legitimate needs within limited resources. What residents could contribute was a clear picture of what a reduction of that size would mean in practice. Library leaders identified four likely consequences:
Two fewer open days each week
Both the Hillsborough and Carrboro branches would have lost two open days each week.
Fewer programs and less outreach
Storytimes, workshops, class visits, and community programs would have been reduced.
Less for books and materials
Approximately $70,000 of the reduction would have come from books and program supplies.
Cuts that become harder to reverse
Fewer open hours can mean fewer visits, and lower use can weaken the case for restoring funding later.
Library leaders explained what the proposed reduction would mean, and the Friends asked residents to share why the library mattered to them. More than 500 people responded in under a week: 502 documented submissions, 237 written testimonials and 265 petition signatures, each shared with consent and delivered to the Board of County Commissioners ahead of the June 4 vote.
On June 4, the Board declined to approve the additional $200,000 reduction, keeping both branches open seven days a week. The adopted budget still reflected the county’s larger financial pressures, but residents helped prevent the most severe proposed service cuts. Read your neighbors’ stories or share yours.
How the Friends help
Public funding keeps the library running. The Friends help make it stronger, and speak up for it when it counts.
Advocacy
The Friends help residents understand what the library needs and make sure community voices reach decision-makers. That was the purpose of our 2026 library funding campaign.
Book sales & events
Money raised locally goes back into the library through programs, equipment, training, and other improvements.
Memberships
Membership creates dependable support and a growing community of people who care about the library’s future, and are ready to stand behind it.
Donations
Gifts allow the Friends to respond when the library has an immediate need or an opportunity worth pursuing.
The Friends supplement public funding; we do not replace it. Memberships, donations, and book sales add programs, equipment, and flexibility. Stable public funding keeps the library open, staffed, and accessible to everyone.
Sources and methodology
Usage and trend figures computed from the Statistical Report of North Carolina Public Libraries (State Library of North Carolina) / IMLS Public Library Survey, FY2023–FY2025. Per-capita state comparisons computed from the IMLS Public Libraries Survey, FY2024 administrative-entity file (per-state and national figures = total operating expenditure ÷ total service-area population); national average $48.21, NC $27.95; DC, U.S. territories, and special-service libraries for the blind and print-disabled excluded. Wake and Durham County figures are those systems’ own records from the same file.
Funding source percentages based on OCPL reporting to the NC State Library. Federal LSTA program information from the State Library of North Carolina.
Amendment OP-B08 details, effect estimates, and community-response figures from the Friends’ compilation Community Responses on Amendment OP-B08, presented to the Orange County Board of County Commissioners on June 4, 2026 (502 responses gathered May 30–June 4, 2026, each with the contributor’s consent). Quotes shown with each contributor’s chosen attribution.
Economic return estimates: Texas State Library & Archives Commission statewide study (2017, $4.64 per $1); Gilpin, Karger & Nencka, American Economic Journal: Economic Policy (2024); EveryLibrary Institute analysis of library funding measures (2021). Story-vs-statistics finding: Horrigan & Duggan (2018), From Awareness to Funding, OCLC Research/ALA/PLA.
These figures show the structure of library funding and the role of community support. They are not intended to suggest that philanthropy can replace strong public investment.